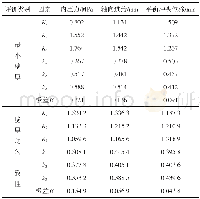
《Table 2 Analysis of the orthogonal test of different indicators of tomato seedlings》
 提示:宽带有限、当前游客访问压缩模式
本系列图表出处文件名:随高清版一同展现
《Effect of Different Combined Treatments on Tomato Seedling Growth in High-temperature Season》
H1,H2,H3and H4denote the indicators of tomato seedlings in strong seedling index,root activity,hypocotyl length,average internode,respectively.Tiis the sum of the results of its level.ti=Ti/3,reflects the average value of its level.
It could be seen from Table 2 that the strong seedling index exhibited a trend of increasing at first and decreasing then with the rhizospheric cooling range and EC value of nutrient solution increasing,and decreasing gradually with the increase of shading rate.The effects of various factors on strong seedling index ranked as B>A>C,and the optimal combination was A2B3C2.The root activity showed a trend of increasing at first and decreasing then with the increase of rhizospheric cooling range,decreasing at first and increasing then with the increase of shading rate,and decreasing with the EC value of the nutrient solution increasing.The effects of various factors on root activity ranked as C>A>B,and the optimal combination was A2B3C1.The hypocotyl length of tomato seedlings increased with the increase of rhizospheric cooling range,and decreased with the EC value of the nutrient solution increasing.The effects of various factors on hypocotyl length of tomato ranked as C>B>A.The average internode length of the first,second and third internode exhibited a trend of increasing at first and decreasing then with the increase of rhizospheric cooling range,increasing with the shading rate increasing,and decreasing with the EC value of the nutrient solution increasing.And effects of various factors on the average internode length of the first,second and third internode ranked as C>A>B.
| 图表编号 | XD00183021800 严禁用于非法目的 |
|---|---|
| 绘制时间 | 2018.06.01 |
| 作者 | Caixia MA、Ke LIU、Yiming ZHANG、Jiqing WANG |
| 绘制单位 | College of Horticulture,Henan Agricultural University、College of Horticulture,Henan Agricultural University、College of Horticulture,Henan Agricultural University、College of Horticulture,Henan Agricultural University |
| 更多格式 | 高清、无水印(增值服务) |
查看“Table 2 Analysis of the orthogonal test of different indicators of tomato seedlings”的人还看了
-

- 表6 不同浓度有机酸盐对酵母菌生长影响的正交试验结果Table 6 Orthogonal test result of the inhibitory effect of different concentrations of organic
-

- 表4 不同浓度有机酸盐对青霉菌生长影响的正交试验结果Table 4 Orthogonal test result of the inhibitory effect of different concentrations of organic


