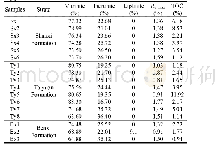
《Table 2 Composition of GDP and employment composition of the Yangtze River Delta》
 提示:宽带有限、当前游客访问压缩模式
本系列图表出处文件名:随高清版一同展现
《Labor Market Changes during Transformation and Upgrading of China's Three Major Special Economic Zones》
Data source:China Statistical Yearbook(2017),Statistical Yearbook of Shanghai(2017),Statistical Yearbook of Zhejiang(2017),and Statistical Yearbook of Jiangsu(2017).
From Table 2,it can be seen that since 2005,the proportion of primary industry and secondary industry in the Yangtze River Delta has gradually declined,and the proportion of tertiary industry has been rising.Specifically,the industrial structure of Shanghai has developed to a relatively high level,and the proportion of the secondary industry has dropped significantly.Since 2005,the secondary and tertiary industries have been keeping pace with each other,and then the proportion of tertiary industry increased rapidly,exceeding the national average,which is consistent with the position of Shanghai as an international economic,financial,and trade center.The economic development of Zhejiang and Jiangsu mainly relied on the growth of the secondary industry in 2005.By2016,the proportion of the tertiary industry was close to the national average level of 58.2%.In 2016,the proportion of the secondary industry in the whole country was 37.4%.Compared with the other two zones,the Yangtze River Delta had a higher level of industrialization.
| 图表编号 | XD00182620900 严禁用于非法目的 |
|---|---|
| 绘制时间 | 2018.10.01 |
| 作者 | Lili HAN |
| 绘制单位 | Business School,Beijing Normal University |
| 更多格式 | 高清、无水印(增值服务) |


