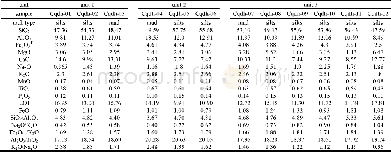
《Table 1 Major element concentrations (wt%) for silts and mud of the Chengqiang section》
 提示:宽带有限、当前游客访问压缩模式
本系列图表出处文件名:随高清版一同展现
《"Tectonically-controlled Evolution of the Late Cenozoic Nihewan Basin, North China Craton: Constraints from Stratigraphy, Mineralogy, and Geochemistry"》
Note:LOI,loss on ignition.
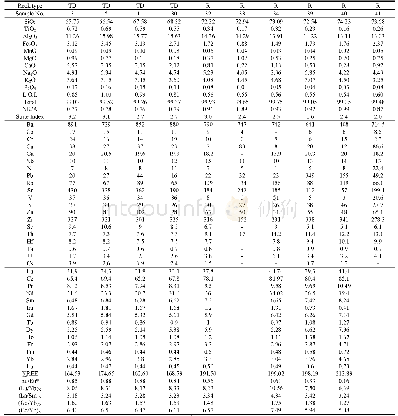
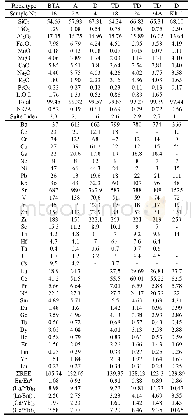
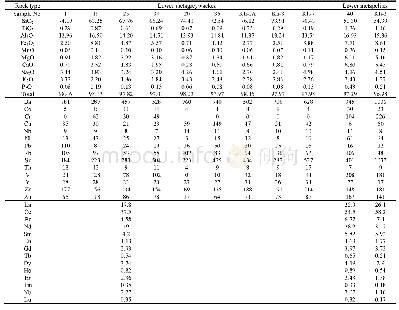
The concentrations of trace elements are listed in Table2.Compared with the Post-Archean Australian Shale(PAAS)(Taylor and Mc Lennan,1985) ,the contents of Cs(4.87–10.4 ppm),Ba(406–579 ppm),Rb(73.8–106 ppm),Sr(221–451 ppm,except Cqdh–10 on 912 ppm),and Sc(9.85–15.5 ppm)are high and similar to PAAS.All LILEs are similar throughout the section.Generally,all samples in the section show high concentration on Zr(103–163ppm),Hf(3.29–5.48 ppm),Nb(10.2–15.9 ppm),and Ta(0.816–1.25 ppm).In all the samples,Zr–Hf and Nb–Ta are strongly correlated,with R2=0.92 and 0.78,respectively.Co(8.31–17.3 ppm),Ni(19.1–39.9 ppm),and V(63.1–95.3 ppm)vary,whereas Cr(51.6–86.4ppm),Sc(9.85–15.5 ppm)and Cr/Ni(1.79–2.71),Ni/Co(2.05–2.75),Sc/Ni(0.33–0.52),and Sc/Cr(0.16–0.21)are similar to UCC in the entire section.Furthermore,the averages are normalized to the average UCC(Fig.7a)(Taylor and Mc Lennan,1985) .Several deviations from the UCC values are observed;these values include negative Sr,P,Ba,Zr,and Nb anomalies;positive U,Cs,and V–Cr–Ni anomalies;and slightly positive Yb–Ti anomalies.
| 图表编号 | XD0017173600 严禁用于非法目的 |
|---|---|
| 绘制时间 | 2018.04.01 |
| 作者 | LIU Jin、CHEN Xingqiang、CHI Zhenqing、WANG Yong、MIN Longrui、LI Tingdong |
| 绘制单位 | School of Civil and Architecture Engineering, Xi'an Technological University、Institute of Geology, Chinese Academy of Geological Sciences、China Railway First Survey and Design Institute Group CO., Ltd.、Institute of Geomechanics, Chinese Academy of Geolog |
| 更多格式 | 高清、无水印(增值服务) |


