《Table 5.Energy range of peaks in spectrum recorded by Chang’e-1GRS》
 提示:宽带有限、当前游客访问压缩模式
本系列图表出处文件名:随高清版一同展现
《Mapping of the lunar surface by average atomic number based on positron annihilation radiation from Chang'e-1》
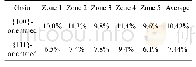
Table 5.εi/ε0.512 a and μEi,are obtained in section 3.
The Geant4 Monte Carlo code has been used to simulate the gamma ray spectra from the lunar surface(Gurtner et al.,2006;Ohishi et al.,2004;Yamashita et al.,2008).The model consists of a cylinder which is filled with the lunar rock and soil with a density of 2.0 g/cm3 and a 40cm-diameter sphere current detector,as shown in Figure 2.The detector is placed on the axis of the cylinder,0.5 m above the cylinder’s upper surface.Six types of lunar rock,including KREEP,anorthosite,dunite,high alumina basalt,low titanium basalt,and high titanium basalt,are used to study the relationship between the average atomic number and the flux of 0.512-Me V gamma rays.The compositions and average atomic numbers of the six lunar rocks are given in Table 1(Heiken et al.,1991).
| 图表编号 | XD0015934500 严禁用于非法目的 |
|---|---|
| 绘制时间 | 2018.05.01 |
| 作者 | LiangQuan Ge、JianKun Zhao、QingXian Zhang、YaoYao Luo、Yi Gu |
| 绘制单位 | College of Applied Nuclear Technology and Automation Engineering,Chengdu University of Technology、School of Nuclear Science and Engineering,East China University of Technology、College of Applied Nuclear Technology and Automation Engineering,Chengdu Univer |
| 更多格式 | 高清、无水印(增值服务) |


