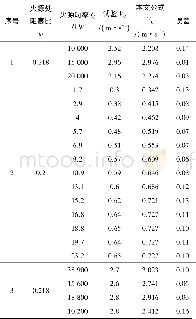
《Table 1.Average flux contribution (%) obtained by footprint analyses from the target underlying sur
 提示:宽带有限、当前游客访问压缩模式
本系列图表出处文件名:随高清版一同展现
《Comparison of Different Generation Mechanisms of Free Convection between Two Stations on the Tibetan Plateau》
Note:Iaindicates that the fetch of the target land-use type is sufficiently large to make the internal boundary layer higher than the measurement height.
This relation can be used to approximately determine the heightδof the new equilibrium layer(Foken,2008a)in order to check the impact of the internal boundary(Eigenmann et al.,2009).Here,x is the fetch(m),and z is the height(m)of the sensor.In this study,the effect of the fence is considered as an obstacle.The measuring height of both sites is greater than twice that of the fence height;hence,the influence of the fence on flux measurements can be neglected.Table 1 shows the results for the approximately calculated fetch of the target underlying surface type for QOMS(gravel mixed with grass)and SETS(high grass).“I”presented in this table indicates that the fetch of the target land-use type is sufficiently large to make the internal boundary layer higher than the measurement height.At QOMS,the new equilibrium layer is below the measurement level in the 270?and 300?directions.The flux measurements within these two sectors are under the influence of the internal boundary layer and should be discarded.However,the influence of the heterogeneous underlying surface on the overall assessment was weak because these regions do not lie in the prevailing wind direction.For the case at SETS,the terrain is more complicated and the fetch of the 30?,60?,90?,120?,330?and 360?sectors denotes the distance between the EC tower and the outer edge of the surface discontinuity.Flux measurements for wind directions of 90?and 120?,where the measuring height of 3.04m is greater thanδ,and 150?,240?,270?and 300?,where the measuring height is lower thanδ,can be associated with the target land-use type(high grass).The footprint analysis results are also presented in Table 1.Generally,if the flux contribution from the target land-use type was less than 80%and theδwas greater than the measurement height,the flux data should be excluded from further analyses(Mauder et al.,2006).
| 图表编号 | XD0015820400 严禁用于非法目的 |
|---|---|
| 绘制时间 | 2018.09.10 |
| 作者 | Lang ZHANG、Yaoming MA、Weiqiang MA、Binbin WANG |
| 绘制单位 | Key Laboratory of Tibetan Environment Changes and Land Surface Processes, Institute of Tibetan Plateau Research,Chinese Academy of Sciences、University of Chinese Academy of Sciences、Key Laboratory of Tibetan Environment Changes and Land Surface Processes, |
| 更多格式 | 高清、无水印(增值服务) |


