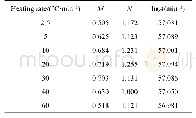
《Tab.3 Parameters used in proposed test cost model》
 提示:宽带有限、当前游客访问压缩模式
本系列图表出处文件名:随高清版一同展现
《三维集成电路绑定中测试成本缩减的优化堆叠顺序(英文)》
The frequency of the test clock is set to be a typical value of 10 M Hz.Tab.3 also lists the parameter values used in our test cost model,w hich are based on the published data in Refs.[12-13].The parameter CATEis set to be 0.23$/s for a typical ATE usage.The parameter Cdieis set to be 4.24×10⁻⁸$/μm2and CTSVis set to be 1.4×10⁻⁹$/μm2for the manufacturing costs.In addition,the parameter ATSVis set to be 10 000μm2for a typical TSV pitch of 100μm.To better prove the effectiveness of our proposed scheme in reducing test cost,w e try to run our experiments under various conditions and circuits(see Fig.1).Baseline 1 is in pyramid type w ith the stacking order in original sequence(die 1 is the bottom layer,namely Layer 1;die 2 is on top of die 1,namely Layer 2,and so forth).Baseline 2 is the reverse order of baseline1.Then,w e w ill vary the total number of TAM w idth,test pow er and the test elevators betw een each tw o layers for mid-bond testing.In addition,w e w ill discuss the test cost of our proposed scheme,compared w ith the baselines.Some substitution w ords in these tables need to be explained.Baseline m eans the original stacking order in sequence(die i represents the i-th layer).Proposed represents the optimal stacking order for test cost reduction proposed in this paper.tsv_max,tam_max and pow er_max represent the maximum test elevators betw een each tw o layers,the maximum TAM w idth and test pow er available during mid-bond testing.Besides,Ratioiis the reduction percentage of total test costs,w hich can be obtained as follow s:
| 图表编号 | XD0015628900 严禁用于非法目的 |
|---|---|
| 绘制时间 | 2018.06.01 |
| 作者 | 倪天明、梁华国、聂牧、卞景昌、黄正峰、徐秀敏、方祥圣 |
| 绘制单位 | 合肥工业大学电子科学与应用物理学院、合肥学院电子信息与电气工程系、合肥工业大学电子科学与应用物理学院、合肥工业大学计算机与信息学院、合肥工业大学电子科学与应用物理学院、合肥工业大学电子科学与应用物理学院、合肥工业大学电子科学与应用物理学院、合肥工业大学计算机与信息学院 |
| 更多格式 | 高清、无水印(增值服务) |
查看“Tab.3 Parameters used in proposed test cost model”的人还看了
-

- Table 2 Values of fitting parameters in autocatalytic model obtained by using mean value of activation energy (468 k J/m


