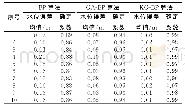
《Table 3 Comparison of simulation results of different algorithms》
 提示:宽带有限、当前游客访问压缩模式
本系列图表出处文件名:随高清版一同展现
《Sequencing of Mixed Model Assembly Lines Based on Improved Shuffled Frog Leaping Algorithm》
In this study,data from Ref.[3]are used.A mixed model assembly line of a refrigerator enterprise has six w orkstations and four kinds of products.The planning of daily production is120 A,40 B,60 C and 40 D.So the M PS is 6 A,2 B,3C and2D.Assembly time of all the products in each w orkstation and length of location are show n in Table 1.Different product assembly requires components as show n in Table 2.The frog sub-population M=4,and the numbers of sub-populations are6,2,3,and 2.
| 图表编号 | XD0014948400 严禁用于非法目的 |
|---|---|
| 绘制时间 | 2018.04.30 |
| 作者 | 赵小强、季树荣 |
| 绘制单位 | College of Electrical and Information Engineering,Lanzhou University of Technology、Key Laboratory of Advanced Control of Industrial Process in Gansu Province、National Experimental Teaching Center for Electrical and Control Engineering of Lanzhou Universit |
| 更多格式 | 高清、无水印(增值服务) |


