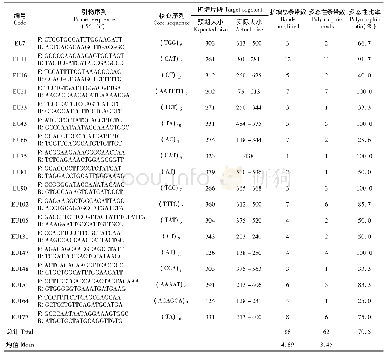
《Table 2–Details of 18 EST–SSR markers selected for genotyping (Sun et al.[21]) .》
![《Table 2–Details of 18 EST–SSR markers selected for genotyping (Sun et al.[21]) .》](http://bookimg.mtoou.info/tubiao/gif/CROP201804013_08700.gif) 提示:宽带有限、当前游客访问压缩模式
提示:宽带有限、当前游客访问压缩模式
本系列图表出处文件名:随高清版一同展现
《Population structure analysis and determination of neurotoxin content in a set of grass pea(Lathyrus sativus L.) accessions of Bangladesh origin》
A set of 100 grass pea accessions from Bangladesh were compared with 18 wild Lathyrus accessions using 18 genic SSR markers(Table 1).A total of 67 unambiguous bands were detected,from 16 polymorphic primers(two primer pairs amplified monomorphic sequences).The average major allele frequency was maximum for accession S-103(0.78)and minimum for S-33(0.26),while for S-231 and S-177 it was0.77 and 0.67,respectively(Table 3).Average PIC ranged from0.30(S-103)to 0.75(S-33),while S-6 and S-117 recorded 0.72and 0.65,respectively(Table 3).Alleles amplified per locus ranged between two to six(Table 3).
| 图表编号 | XD0012330300 严禁用于非法目的 |
|---|---|
| 绘制时间 | 2018.08.01 |
| 作者 | Priyanka Gupta、Sripada M.Udupa、Debjyoti Sen Gupta、Jitendra Kumar、Shiv Kumar |
| 绘制单位 | International Center for Agricultural Research in the Dry Areas, Rabat Institute、International Center for Agricultural Research in the Dry Areas, Rabat Institute、Department of Plant Sciences, North Dakota State University、ICAR-Indian Institute of Pulses R |
| 更多格式 | 高清、无水印(增值服务) |


