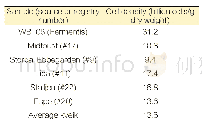
《Table 3–Selection response and genetic variance of the selected progenies from four parental select
 提示:宽带有限、当前游客访问压缩模式
本系列图表出处文件名:随高清版一同展现
《Use of genomic selection and breeding simulation in cross prediction for improvement of yield and quality in wheat(Triticum aestivum L.)》
TKW,thousand-kernel weight;SP,spike number;KN,kernel number;HD,heading date;PH,plant height;PC,protein content;EA,extension area;EXT,extensibility;MR,maximum resistance;ST,stability time.
Trait correlations changed from parental to progeny populations.As an example,Fig.7 shows distribution of correlations between two quality traits and yield.In the training population,the correlation was-0.02 between MR and yield,and-0.68 between EXT and yield(Table 2).However,the correlations ranged from-0.61 to 0.63 for MR(Fig.7-A)with a mean of-0.008,and from-0.88 to 0.27 for EXT(Fig.7-B)with a mean of-0.51.Thus,even though a quality trait showed a strong negative correlation with yield in training population,it was still possible to see a positive correlation in the progeny population derived from two parents selected from the training population.
| 图表编号 | XD0012327200 严禁用于非法目的 |
|---|---|
| 绘制时间 | 2018.08.01 |
| 作者 | Ji Yao、Dehui Zhao、Xinmin Chen、Yong Zhang、Jiankang Wang |
| 绘制单位 | The National Key Facility for Crop Gene Resources and Genetic Improvement, National Wheat Improvement Center, Institute of Crop Sciences,Academy of Agricultural Sciences、The National Key Facility for Crop Gene Resources and Genetic Improvement, National W |
| 更多格式 | 高清、无水印(增值服务) |
查看“Table 3–Selection response and genetic variance of the selected progenies from four parental selection schemes (S1 to S4”的人还看了
-

- Table 6 Analysis of variance components and genetic gains of growth characters from open-pollinated progenies
-

- Table 1“Participants,Intervention,Comparison,Outcome and Study Design”approach for the selection of clinical studies fol


