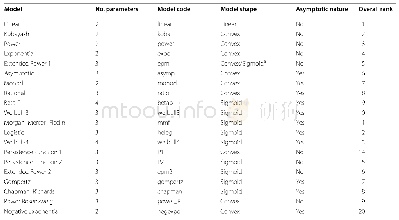
《Table 1 The twenty SAR models compared in the model selection,including the number of parameters,ge
 提示:宽带有限、当前游客访问压缩模式
本系列图表出处文件名:随高清版一同展现
《A global consistent positive effect of urban green area size on bird richness》
a The epm1 model can be either convex or sigmoidal in shape depending on the parameter values
When the model selection profiles of all datasets using a subset of predictor variables(n=37)were used as the response variable,and 0.05 was used as the significance threshold for predictor variables in the CAP analysis,the only significant predictor variable was the number of islands(F=5.6;P<0.001),and this explained only 8.5%of the variation in the data.The performance of the linear model was influenced by the number of green areas and the minimum number of species analyzed in each study,whereas the performance of more complex models such as Beta-P and Extended Power 1 were positively related to the number of green areas in each dataset(Fig.5a).When model shape(i.e.vectors of wAICc summed across models for each shape)was used as the response variable,the only significant predictor was the minimum species richness observed in a dataset(F=2.0;P=0.03),but again,this only explained a small amount of variation in the data(5.4%).The performance of the linear model was positively related to the minimum number of species in each dataset,whereas convex models were negatively related to that variable(Fig.5b).
| 图表编号 | XD00109451300 严禁用于非法目的 |
|---|---|
| 绘制时间 | 2019.09.01 |
| 作者 | Lucas M.Leveau、Adriana Ruggiero、Thomas J.Matthews、M.Isabel Bellocq |
| 绘制单位 | Departamento de Ecología, Genética y Evolución, Facultad de Ciencias Exactas y Naturales, Universidad de Buenos Aires-IEGEBA (CONICET-UBA),Intendente Güiraldes 2160, Ciudad Universitaria、Laboratorio Ecotono, Centro Regional Universitario Bariloche-Univers |
| 更多格式 | 高清、无水印(增值服务) |

