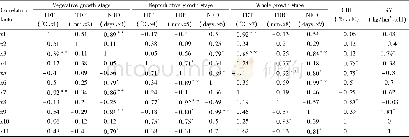
《Table 5–AMMI adjusted combined mean grain yield (t ha-1) , IPCA scores of 33 cowpea mutant genotype
 提示:宽带有限、当前游客访问压缩模式
本系列图表出处文件名:随高清版一同展现
《Genotype-by-environment interaction for grain yield among novel cowpea(Vigna unguiculata L.) selections derived by gamma irradiation》
IPCA,interaction principal component axis;ASV,AMMI stability.E1,Bagani 2014/2015;E2,Bagani 2015/2016;E3,Mannheim 2014/2015;E4,Mannheim 2015/2016;E5,Omahenene 2014/2015;E6,Omahenene 2015/2016.See codes of genotypes(G1 to G37)in Table 3.
The study was conducted at three sites:Bagani(-18°09′61.93″S,21°56′24.14″E),Mannheim(19°12′21.4″S,17°42′29.1″E),and Omahenene(-17°44′29.04″S,14°78′48.21″E)during the 2014/2015 and 2015/2016 cropping seasons.This plan provided six testing environments including Bagani 2014/2015,Bagani2015/2016,Mannheim 2014/2015,Mannheim 2015/2016,Omahenene 2014/2015,and Omahenene 2015/2016.The physicochemical properties of soils at Bagani,Mannheim and Omahenene research sites are described by Horn et al.[14].Mean monthly and total rainfall(mm)at the three sites during 2014/2015 and 2015/2016 are presented in Table 1.The study used 37 cowpea genotypes comprising 34 newly developed mutant lines,selected for their superior agronomic performance,and three parental checks(Bira,Nakare and Shindimba).The mutants were at the M6 generation in 2014/2015 and M7 in 2015/2016.Details of the genotypes are presented in Table 2.
| 图表编号 | XD0012325100 严禁用于非法目的 |
|---|---|
| 绘制时间 | 2018.06.01 |
| 作者 | Lydia Horn、Hussein Shimelis、Fatma Sarsu、Learnmore Mwadzingeni、Mark D.Laing |
| 绘制单位 | African Centre for Crop Improvement,University of Kwa Zulu-Natal、Directorate of Research and Training,Plant Production Research,Ministry of Agriculture,Water and Forestry、African Centre for Crop Improvement,University of Kwa Zulu-Natal、Plant Breeding and |
| 更多格式 | 高清、无水印(增值服务) |
查看“Table 5–AMMI adjusted combined mean grain yield (t ha-1) , IPCA scores of 33 cowpea mutant genotypes and their three par”的人还看了
-

- Table 1 Grain yield results of different test sites, different nitrogen amounts and different ratios of controlled-relea
-

- Table 1 Grain yield and yield attributes in hybrid rice transplanted with single seedlings under conventional tillage (C
-

- 表7 不同机型谷物联合收割机单位面积燃油消耗量Table 7Different types of grain combine harvester per unit area fuel consumption


