《Table 2 Statistics of SPAD and chlorophyll》
 提示:宽带有限、当前游客访问压缩模式
本系列图表出处文件名:随高清版一同展现
《浙江毛竹叶绿素野外测量与实验室分析数据集(2018)》
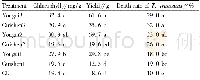
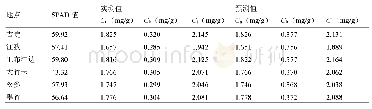
According to Table 2,SPAD ranges from 27.4 to 47.6,with an average of 40.47;and Chl ranges from 26.51 to 70.72μg/cm2,with a mean of 51.48μg/cm2.
| 图表编号 | XD00110319500 严禁用于非法目的 |
|---|---|
| 绘制时间 | 2019.06.25 |
| 作者 | 王正兴、李芳 |
| 绘制单位 | 中国科学院地理科学与资源研究所资源与环境信息系统国家重点实验室、中国科学院地理科学与资源研究所资源与环境信息系统国家重点实验室 |
| 更多格式 | 高清、无水印(增值服务) |
