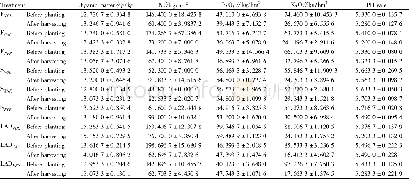
《Table 1.Aerosol components, geometric standard deviation (σ) , and geometric mean radius (ro) of ea
 提示:宽带有限、当前游客访问压缩模式
本系列图表出处文件名:随高清版一同展现
《Assessment of the regional source contributions to PM_(2.5) mass concentration in Beijing》
notes:Aso4,sulfate aerosol;Ano3,nitrate aerosol;Anh4,ammonium aero-sol;Bc,black carbon;oc,organic carbon.
The RAMS-CMAQ modeling system was used to simulate the transport,transformation and deposition of aerosols and their precursors.The major component of this modeling system is CMAQ(version 5.0.2),released in 2014 by the US Environmental Protection Agency for simulating a variety of environmental issues(Eder and Yu 2006;Mathur et al.2008)including tropospheric ozone,haze pollution,and acid deposition.In the modeling system,the SAPRC99(Statewide Air Pollution Research Centre)and ISORROPIA(Nenes,Pandis,and Pilinis 1998)schemes were chosen to estimate the gas-phase concentrations and aerosol particles,respectively.The sixth-generation modal CMAQ aerosol model(AERO6)were applied to simulate the gas-phase chemistry mechanisms and formation,dynamic processes of aerosols.The size distributions of aerosols were treated as three modes(Aitken,accumulation,and coarse)following a log normal distribution,as shown in Table 1.The numerical prediction model,RAMS(version 6.0)(Cotton et al.2003) ,was coupled with CMAQ offline to provide the meteorological field.The ECMWF reanalysis datasets(spatial resolution:1°×1°)were used to supply the background meteorological fields and sea surface temperature.
| 图表编号 | XD00881700 严禁用于非法目的 |
|---|---|
| 绘制时间 | 2018.03.16 |
| 作者 | HAN Xiao、ZHANG Mei-Gen |
| 绘制单位 | State Key Laboratory of Atmospheric Boundary Layer physics and Atmospheric Chemistry, Institute of Atmospheric Physics, Chinese Academy of Sciences、College of Earth Science, University of Chinese Academy of Sciences、State Key Laboratory of Atmospheric Bou |
| 更多格式 | 高清、无水印(增值服务) |


