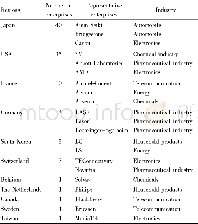
《Table 1The BSA and TPV values determined from the N2 adsorption‐desorption isotherms, and the N and
N2 adsorption/desorption isotherms and the Bar‐rett‐Joyner‐Halenda(BJH)pore‐size distribution(Fig.S1)are key to elucidating the structures of the formed nanocarbons.The pore sizes of the samples containing nanotubes(i.e.,Fe N‐CNT/CS and Fe N‐CNT)are in the range of~0–100 nm;in comparison,the pore sizes of N‐CS are in the range of~50–1000 nm.Therefore,the Brunauer‐Emmett‐Teller(BET)surface areas(BSAs)and total pore volumes(TPVs)of Fe N‐CNT/CS and Fe N‐CNT can be attributed to the mesoscale pores.Table 1 shows that the BSA and TPV values of Fe N‐CNT/CS are 177 m2/g and 0.41 cm3/g,respectively,which facilitate the dispersion of the Fe‐Nx species.Both the single materials provided lower BSA and TPV values:68 m2/g and0.21 cm3/g,respectively,for Fe N‐CNT and 160 m2/g and 0.36cm3/g,respectively,for N‐CS.From these results,it is reasona‐ble to propose that there is an effective synergy between the nanotubes and CS in Fe N‐CNT/CS that does not occur in the absence of either component.This supports that the CS tem‐plate promotes both the formation of Fe‐Nx active sites and ORR performance.
| 图表编号 | XD008192700 严禁用于非法目的 |
|---|---|
| 绘制时间 | 2018.08.01 |
| 作者 | 张世明、张鹤友、张维民、原鲜霞、陈胜利、马紫峰 |
| 绘制单位 | 上海交通大学化学工程系上海电化学能源器件工程技术研究中心、武汉大学化学与分子科学学院湖北省化学电源材料与技术重点实验室教育部生物医学分析化学重点实验室、上海中聚佳华电池科技有限公司中聚电池研究院、武汉大学化学与分子科学学院湖北省化学电源材料与技术重点实验室教育部生物医学分析化学重点实验室、上海交通大学化学工程系上海电化学能源器件工程技术研究中心、上海交通大学化学工程系上海电化学能源器件工程技术研究中心、武汉大学化学与分子科学学院湖北省化学电源材料与技术重点实验室教育部生物医学分析化学重点实验室、上海交通大 |
| 更多格式 | 高清、无水印(增值服务) |
 提示:宽带有限、当前游客访问压缩模式


