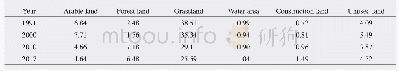
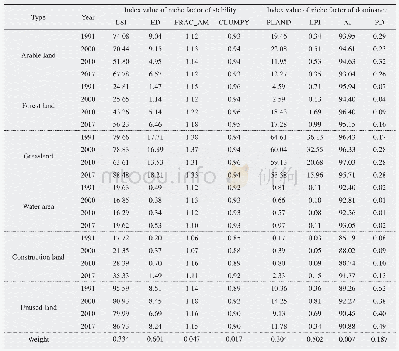
《Table 4 The attribute value of dominance of each landscape component from 1991 to 2017》
 提示:宽带有限、当前游客访问压缩模式
本系列图表出处文件名:随高清版一同展现
《"A case study on Landscape Component Niche based on Landscape Pattern Indices: Yanchi,Ningxia Province, China"》
Table 4 can be obtained by calculating the index values of dominance factor of each landscape compo‐nent and the weights of each index in Table 2.It can be seen from Table 4 that in 1991 and 2000,the domi‐nance degree of each landscape component type fol‐lowed the trend:grassland>arable land>unused land>woodland>water area>construction land.In2010 and 2017,the dominance degree of each land‐scape component type was grassland>woodland>ar‐able land>unused land>construction land>water area.From the annual change of different landscape component types:1)dominant values of grassland de‐creased,indicating that the dominance of grassland decreased in the overall landscape.2)dominant val‐ues of the construction land increased,indicating that the ability of the landscape group matching the entire landscape was enhanced.3)dominant values of arable land first increased and then decreased with its domi‐nance being highest in 2000 and lowest in 2017.4)dominant values of unused land,woodland and water area generally increased,but there were incidence of fluctuation during the period,indicating that the domi‐nant positions of these landscape components were getting higher and higher as the control effect of the overall landscape enhanced.
| 图表编号 | XD00132562700 严禁用于非法目的 |
|---|---|
| 绘制时间 | 2020.02.01 |
| 作者 | XiaoNing Zhang、XueLu Liu、Ghanney Philip、XiaoDan Li、QuanXi Wang、YaNan Xu、TingTing Hui |
| 绘制单位 | College of Resources and Environmental Sciences, Gansu Agricultural University、College of Resources and Environmental Sciences, Gansu Agricultural University、College of Resources and Environmental Sciences, Gansu Agricultural University、College of Managem |
| 更多格式 | 高清、无水印(增值服务) |
