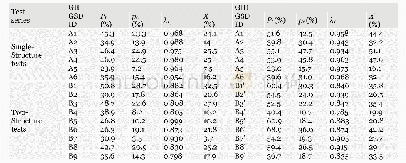
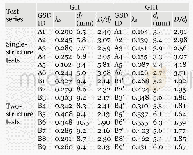
《Table 4 Sediment control efficiency parameters from experimental results》
 提示:宽带有限、当前游客访问压缩模式
本系列图表出处文件名:随高清版一同展现
《Determination of optimal grid opening width for herringbone water-sediment separation structures based on sediment separation efficiency》
Notes:GSD ID means the identity of grain size distribution;Pt is the total sediment separation rate;pc is the coarse sediment separation rate,which means the percentage of separated coarse sediment to the total input sediment before herringbone water-sedi
The test values for pc,λ1,and X for each test group were calculated and provided in Table 4.The values ofλ1 were within the range of 0.8~1.0,which is in accordance with the results of Xie et al.(2014).Figure 5 showed a more specific detail.For the single-structure tests,values ofλ1 were even larger than 0.9,which may be attributed to the small sediment volume and debris flow discharge.When sediment volumes increased in the twostructure tests,λ1 decreased to 0.8~0.9,with an arithmetic mean value of 0.868.Regression analysis using the whole dataset comprising pc and X values in Table 4 suggested thatλ1=0.873 based on Eq.3(Figure 6),which is similar to the twostructure test average value of 0.868.A preliminary conclusion could be reached that the coarse separation rate has little relations to structural parameters and sediment composition,but may be influenced by debris flow volume and sediment concentration.The value of 0.873 was suggested a representative value forλ1 when considering quantitative design.This result contributes a more explicit instruction for the future use rather than the range of 0.85-1.0 suggested by Xie et al.(2017a).
| 图表编号 | XD0056565800 严禁用于非法目的 |
|---|---|
| 绘制时间 | 2019.03.01 |
| 作者 | XIE Xiang-ping、WEI Fang-qiang、WANG Xiao-jun、YANG Hong-juan |
| 绘制单位 | Anyang Institute of Technology、Chongqing Institutes of Green and Intelligent Technology,Chinese Academy of Science、Anyang Institute of Technology、Institute of Mountain Hazards and Environment,Chinese Academy of Sciences |
| 更多格式 | 高清、无水印(增值服务) |
查看“Table 4 Sediment control efficiency parameters from experimental results”的人还看了
-

- Table 4 Electrochemical parameters and inhibition efficiencies for Q235 steel derived from cathodic and anodic polarizat


