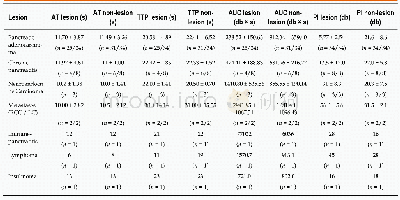
《Table 3 Quantitative analysis of different perfusion parameters》
 提示:宽带有限、当前游客访问压缩模式
本系列图表出处文件名:随高清版一同展现
《Instant evaluation of contrast enhanced endoscopic ultrasound helps to differentiate various solid pancreatic lesions in daily routine》
AT:Arrival time;TTP:Time to peak intensity;AUC:Area under the curve;PI:Peak intensity;RCC:Renal cell carcinoma;LC:Lung cancer;db:Decibel.
Of those 55 patients,CEH-EUS showed hypoenhanced lesions in 39 cases,while in13 patients contrast agent characteristics were classified as hyperenhanced by the investigator upon investigation and 3 lesions as non-enhanced.Calculation of signal intensity later on showed signal intensity of 6.1±3.2 db for lesions classified as hypoenhanced and 39.0±13.0 db for lesions classified as hyperenhanced.Nonenhanced lesions showed signal intensity of 1.3±0.3 db(Table 1).
| 图表编号 | XD0054200300 严禁用于非法目的 |
|---|---|
| 绘制时间 | 2019.01.06 |
| 作者 | Klaus Kannengiesser、Reiner Mahlke、Frauke Petersen、Anja Peters、Torsten Kucharzik、Christian Maaser |
| 绘制单位 | Department of General Internal Medicine and Gastroenterology, University Teaching Hospital Lueneburg、Department of General Internal Medicine and Gastroenterology, University Teaching Hospital Lueneburg、Department of General Internal Medicine and Gastroent |
| 更多格式 | 高清、无水印(增值服务) |
查看“Table 3 Quantitative analysis of different perfusion parameters”的人还看了
-

- 表2 不同放化疗疗效患者治疗前CT灌注参数比较±s Tab.2 The comparison of perfusion parameters between different response groups before treatmen


