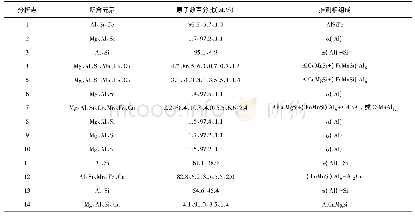
《Table 1 Semi-quantitative results of energy spectrum analysis》
 提示:宽带有限、当前游客访问压缩模式
本系列图表出处文件名:随高清版一同展现
《Investigation of the transformation of sink-roll groove-mark defect in the galvannealing process》
%
Fig.4 show s the surface morphologies of the coating at the defect and normal locations in the galvannealed sample,and Table 1 show s the semiquantitative results of the energy spectrum analysis at these different locations.In the groove-mark defect area,there w ere some convex points about10μm in size on the coating surface,w hereas the surface of the normal coating had no such characteristics.After being galvannealed,the surface at the normal position w as in theζphase,in w hich the surface is smooth and the phase structure is very uniform.The energy spectrum results show that the coating contained about 8.2%Fe.In the groovemark defect area,most of the surface w as the same as that of the normal coating.How ever,a number of convex points w ere found in some local areas,w ith a size similar to the flat points on the as-received GI coating,as show n in Fig.3.The surface morphology at this convex position differed from that of the normal coating.Although it is still in theζphase,it is finer than that of the normal coating,and the boundary betw een theζphases is not so clear.The results of the energy spectrum analysis show that the Fe content at this position w as low er than that of the normal coating,w hereas the Al content w as a little higher than that of the normal coating.This is consistent w ith the high Al content detected on the local surface of the GI coating.
| 图表编号 | XD004656400 严禁用于非法目的 |
|---|---|
| 绘制时间 | 2018.12.30 |
| 作者 | LU Yong、WANG Kai、JIN Xinyan |
| 绘制单位 | Cold Rolling Plant,Baoshan Iron & Steel Co.,Ltd.、Research Institute,Baoshan Iron & Steel Co.,Ltd.、Research Institute,Baoshan Iron & Steel Co.,Ltd.、State Key Laboratory of Development and Application Technology of Automotive Steels( Baosteel) |
| 更多格式 | 高清、无水印(增值服务) |


