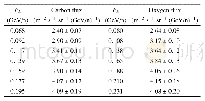
《Table 1 B/C ratio observed by ACE-CRIS from May 19, 2011 to May 26, 2016》
 提示:宽带有限、当前游客访问压缩模式
本系列图表出处文件名:随高清版一同展现
《Implications on cosmic ray injection and propagation parameters from Voyager/ACE/AMS-02 nucleus data》
The ACE-CRIS data are extracted from the ACE Science Center2) ,adopting the same observational period as that of AMS-02(from May 19,2011 to May 26,2016).The systematical uncertainties of the flux measurements come from the geometry factor(2%),the scintillating optical fiber trajectory efficiency(2%),and the correction for spallation in the instrument(~1%-5%)[34].The total uncertainties are obtained through quadratically adding the statistical ones and the systematical ones together[34].Since the energy ranges of boron and carbon nuclei are different,their fluxes are interpolated to common energy grids as in ref.[34].The ACE-CRIS data about the B/C ratio,the carbon and oxygen fluxes are give in Tables 1 and 2.
| 图表编号 | XD0052897500 严禁用于非法目的 |
|---|---|
| 绘制时间 | 2019.04.01 |
| 作者 | Qiang Yuan |
| 绘制单位 | Key Laboratory of Dark Matter and Space Astronomy, Purple Mountain Observatory, Chinese Academy of Sciences、School of Astronomy and Space Science, University of Science and Technology of China、Center for High Energy Physics, Peking University |
| 更多格式 | 高清、无水印(增值服务) |
查看“Table 1 B/C ratio observed by ACE-CRIS from May 19, 2011 to May 26, 2016”的人还看了
-

- Table 4 Equivalent circuit parameters determined by modeling impedance spectra of samples A, B, C and D in 3 wt.%Na Cl s
-

- Table 2 Equivalent circuit parameters determined by modeling impedance spectra of samples A, B, C and D in 10 wt.%Na OH


