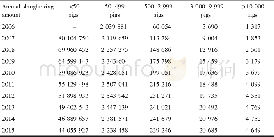
《Table 3.Number of hourly observations in China from 2014 to 2016, as well as number and ratio of ou
 提示:宽带有限、当前游客访问压缩模式
本系列图表出处文件名:随高清版一同展现
《Probabilistic Automatic Outlier Detection for Surface Air Quality Measurements from the China National Environmental Monitoring Network》
The PAOD method was applied to detect outliers in the raw data of the hourly observations of six pollutants(PM2.5,PM10,SO2,NO2,CO and O3)during 2014–16.The raw data were monitored by the CNEMN network.The network contains 1436 monitoring stations across China,and the monitored data are directly transmitted to the data center at the CNEMC.The raw data in this paper are hourly observations directly acquired from the data center at the CNEMC.The number of outliers identified by the method and their proportions are shown in Table 3.Among the raw data,0.65%–5.68%are identified as outliers.There are more outliers in the PM10and CO observations than other pollutants,accounting for 5.68%and 1.03%respectively.The NO2and SO2observations have fewer outliers than the other pollutants,accounting for only 0.65%and 0.73%respectively.For PM2.5,SO2,NO2,CO and O3observations,the ST-outliers are the most frequent among the four types of outliers,accounting for 0.46%–0.77%of the raw data.The LV-outliers rank second,accounting for 0.09%–0.19%.The P-outliers are an important type of outlier for gaseous pollutants,especially CO and SO2.For PM10observations,the LP-outliers account for4.73%of the raw data and are the main source of abnormal observations(see section 2.7 for why the PM2.5data are more reliable than the PM10data).
| 图表编号 | XD0015821800 严禁用于非法目的 |
|---|---|
| 绘制时间 | 2018.12.10 |
| 作者 | Huangjian WU、Xiao TANG、Zifa WANG、Lin WU、Miaomiao LU、Lianfang WEI、Jiang ZHU |
| 绘制单位 | State Key Laboratory of Atmospheric Boundary Layer Physics and Atmospheric Chemistry,Institute of Atmospheric Physics, Chinese Academy of Sciences、University of Chinese Academy of Science、State Key Laboratory of Atmospheric Boundary Layer Physics and Atmo |
| 更多格式 | 高清、无水印(增值服务) |


