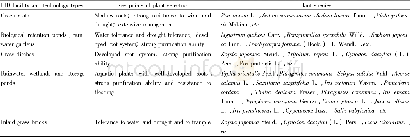
《Table 2–Concentrations of the selected organophosphorus pesticides found in river water in Japan.》下
 提示:宽带有限、当前游客访问压缩模式
本系列图表出处文件名:随高清版一同展现
《"Temporal trends in organophosphorus pesticides use and concentrations in river water in Japan, and risk assessment"》
The OP data used were obtained from the Japanese National Institute of Environmental Studies database(NIES,2015).OP use data were available for all 47 Japanese prefectures.Particular interest was paid to the total amounts of OPs used each year in each prefecture.OPs were selected to represent each main use type(herbicide,fungicide,and insecticide).The chemical structures of the selected OPs are shown in Fig.1and the modes of action,CAS numbers,and classifications of the OPs are shown in Table 1.Data for the risk assessments for the OPs were obtained from previous publications(JACC,2010;USEPA,2016;PPDB,2017).OP concentrations in the water of different rivers(location presented in Fig.2)in Japan for use in theriskassessmentswereobtainedfromprevious publications.
| 图表编号 | XD0052056600 严禁用于非法目的 |
|---|---|
| 绘制时间 | 2019.05.15 |
| 作者 | Aly Derbalah、Russel Chidya、Waqar Jadoon、Hiroshi Sakugawa |
| 绘制单位 | Graduate School of Biosphere Science 1-7-1、Pesticides Chemistry and Toxicology Department, Faculty of Agriculture, Kafrelsheikh University、Graduate School of Biosphere Science 1-7-1、Department of Water Resources Management and Development, Faculty of Envi |
| 更多格式 | 高清、无水印(增值服务) |


