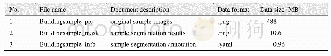
《Table 2 Description of the selected landscape metrics (McGarigal and Marks, 1995)》
 提示:宽带有限、当前游客访问压缩模式
本系列图表出处文件名:随高清版一同展现
《Evaluating and modeling the spatiotemporal pattern of regional-scale salinized land expansion in highly sensitive shoreline landscape of southeastern Iran》
Note:NP,number of patches;PD,patch density;MPS,mean patch size;MNN,mean nearest neighbor distance;LPI,largest patch index.
A pixel-based procedure was used to evaluate the accuracy of the classification process based on overall accuracy and Kappa coefficient statistics.Reference sample points were equally distributed between marginal and interior pixels of salinized land polygons to avoid biased accuracy results,especially the effect of positional error(see Lunetta and Lyon,2004).A small set of landscape metrics including the number of patches(NP),patch density(PD),mean patch size(MPS),mean nearest neighbor distance(MNN)and largest patch index(LPI).NP and MPS metrics were chosen to investigate the degree of dispersive/organic(edge growth)pattern of salt land expansion.Spatial continuity of salt land expansion was also explored through quantification of PD and MNN.LPI was used to estimate the proportional growth rate of the largest salt land patch located in the southeastern study area.Table 2 provided a brief explanation of the selected landscape metrics in this research.
| 图表编号 | XD0020365900 严禁用于非法目的 |
|---|---|
| 绘制时间 | 2018.12.01 |
| 作者 | Mohammad SHAFIEZADEH、Hossein MORADI、Sima FAKHERAN |
| 绘制单位 | Department of Natural Resources, Isfahan University of Technology、Department of Natural Resources, Isfahan University of Technology、Department of Natural Resources, Isfahan University of Technology |
| 更多格式 | 高清、无水印(增值服务) |