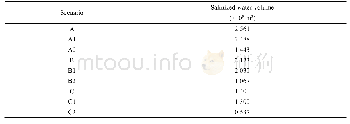
《Table 4 Description of the simulated scenarios》
 提示:宽带有限、当前游客访问压缩模式
本系列图表出处文件名:随高清版一同展现
《"Hydrological and economic feasibility of mitigating a stressed coastal aquifer using managed aquifer recharge: a case study of Jamma aquifer, Oman"》
Note:A,the base scenario;NA,not applicable;MAR,managed aquifer recharge;Upstream,the injection was performed 16.5 km upstream of the coastline(approximately 12.5 km from the water supply line);Downstream,in the vicinity of the farming area and appro
Eight scenarios(which are divided into 3 main groups:A,B and C)were simulated and are presented in Table 4.The simulation time is set as 20 a,with 244 stress periods of 30 d each.Scenario A considers the case\""business as usual\"",which simulates the current situation assuming that no changes(in terms of management and climatic conditions)will take place for the next 20 a.Scenario A will thus be considered as the base scenario,with which the results of the other scenarios are compared.The responses of the aquifer to MAR using TWW in two injection locations were simulated(scenarios A1 and A2).The locations of the injection wells were taken into consideration of land availability because the zone is densely populated and privately owned.The locations of wells are given as Zone 1 for upstream and Zone 2 for downstream(vicinity of farms)in Figure 3.The injected volume is based on the availability of excess TWW(31×106 m3/a),as reported by the Haya Water Company(Zekri et al.,2013).Scenarios B and C are based on policies recommended by the Ministry of Agriculture and Fisheries of Oman(Oman Salinity Strategy,2012)and by the MRMWR in Oman(Abdel-Rahman and Abdel-Magid,1993),as shown in Table 4.
| 图表编号 | XD0031566900 严禁用于非法目的 |
|---|---|
| 绘制时间 | 2019.02.01 |
| 作者 | Mustafa EL-RAWY、Ali AL-MAKTOUMI、Slim ZEKRI、Osman ABDALLA、Rashid AL-ABRI |
| 绘制单位 | Sultan Qaboos University、Civil Engineering Department, Faculty of Engineering, Shaqra University、Department of Civil Engineering, Faculty of Engineering, Minia University、Sultan Qaboos University、Sultan Qaboos University、Sultan Qaboos University、Ministry |
| 更多格式 | 高清、无水印(增值服务) |


