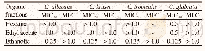
《Table 1–Concentrations and MDL of VOCs.》
 提示:宽带有限、当前游客访问压缩模式
本系列图表出处文件名:随高清版一同展现
《"The levels, sources and reactivity of volatile organic compounds in a typical urban area of Northeast China"》
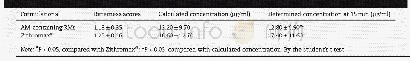
The atmospheric concentrations of selected VOCs in several Chinese cities are compared with those measured by this study in Shenyang(Table 2).The concentrations of alkanes and alkenes measured by this study were within the range of the values reported in the other cities,while the concentrations of aromatics and carbonyls measured by this study were less than most of the others.The large variations in the concentrations reported in different cities occurred not only because of the different strength of the VOC sources,but could also be ascribed to the different number of species measured in different cities.In addition,the selected studies were conducted in different years,and the inter-annual variation might be another reason for the differences among the reported VOC concentrations.
| 图表编号 | XD0052055500 严禁用于非法目的 |
|---|---|
| 绘制时间 | 2019.05.15 |
| 作者 | Zhuobiao Ma、Chengtang Liu、Chenglong Zhang、Pengfei Liu、Can Ye、Chaoyang Xue、Di Zhao、Jichen Sun、Yiming Du、Fahe Chai、Yujing Mu |
| 绘制单位 | Research Center for Eco-Environmental Sciences, Chinese Academy of Sciences、University of Chinese Academy of Sciences、Research Center for Eco-Environmental Sciences, Chinese Academy of Sciences、Center for Excellence in Regional Atmospheric Environment, In |
| 更多格式 | 高清、无水印(增值服务) |

