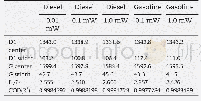
《Table 3–Curve-fitting results of all spectra from both soot samples using two-band (2 L) fitting me
 提示:宽带有限、当前游客访问压缩模式
本系列图表出处文件名:随高清版一同展现
《Raman spectroscopy of diesel and gasoline engine-out soot using different laser power》
As the first step,two band fitting method(D1 and G bands)is considered.Three different functions,including Gaussian Lorentzian,and Voigt,are used to fit the two bands.To identify the best fitting,different combinations of the three fitting functions(Gaussian,Lorentzian,Voigt)were tested on the spectrum taken with 0.1 mW from diesel soot sample Effectiveness of the fitting curve is evaluated based on the value of COD(R2).“1”indicates a perfect fitting,while“0”indicates the worst fitting.The results are listed in Table 2.All fittings involving Gaussian lineshape show relatively low COD while fittings involving Lorentzian lineshape consistently give the highest COD.Performance of Voigt function is between Gaussian and Lorentzian.The combination of Lorentzian+Lorentzian(2L)gives the best fit to the experimental data.
| 图表编号 | XD0052053600 严禁用于非法目的 |
|---|---|
| 绘制时间 | 2019.05.15 |
| 作者 | Haiwen Ge、Zhipeng Ye、Rui He |
| 绘制单位 | Department of Mechanical Engineering, Texas Tech University、Department of Electrical and Computer Engineering, Texas Tech University、Department of Electrical and Computer Engineering, Texas Tech University |
| 更多格式 | 高清、无水印(增值服务) |
查看“Table 3–Curve-fitting results of all spectra from both soot samples using two-band (2 L) fitting method.”的人还看了
-

- 表4 Ni-Ti N纳米镀层的电化学阻抗谱拟合参数Table 4 Fitting parameters from electrochemical impedance spectra of Ni-Ti N nanocoatings
-

- Table 4–Comparison of different three-band fitting methods for spectrum from the diesel soot measured using 0.1 mW laser


