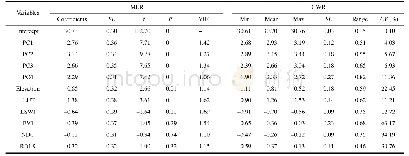
《Table 4 Multiple regression of interpolated species richness against four selected factors (LA, STR
 提示:宽带有限、当前游客访问压缩模式
本系列图表出处文件名:随高清版一同展现
《"Elevational patterns of bird species richness on the eastern slope of Mt.Gongga,Sichuan Province,China"》
r2adj is the adjusted r2 value for multiple regressions Negative relationships are indicated by“-”LA land area,STR seasonal temperature range,IB invertebrate biomass,MDE the mid-domain effect Numbers in italics indicate significant r2 values (p<0.05)
The spatial autocorrelation in regression residuals and multicollinearity among explanatory variables could affect the credibility of the results and needs to be taken into account(Diniz et al.2003;Graham 2003).However,multiple conditional autoregressive(CAR)analyses are not robust to small sample sizes(Wu et al.2013b).Instead,multiple OLS models were used to assess the influence of spatial autocorrelation on the regression results.However,no p value was reported for the multiple regressions(Graham 2003;Brehm et al.2007).Because MDT,EVI and SP were highly correlated with STR(Table 1),we conducted multiple regression models without MDT,SP and EVI to reduce the multicollinearity in the model.Only LA,IB,MDE and STR were tested in the multiple regressions for all species categories.All analyses were performed in the R packages“MuMIn”(Kamil 2018)and“vegan”(Oksanen et al.2013).
| 图表编号 | XD0047412100 严禁用于非法目的 |
|---|---|
| 绘制时间 | 2019.03.01 |
| 作者 | Xingcheng He、Xiaoyi Wang、Shane DuBay、Andrew Hart Reeve、Per Alstrm、Jianghong Ran、Qiao Liu、Yongjie Wu |
| 绘制单位 | Key Laboratory of Bio-resources and Eco-environment of Ministry of Education,College of Life Sciences,Sichuan University、Key Laboratory of Bio-resources and Eco-environment of Ministry of Education,College of Life Sciences,Sichuan University、Committee on |
| 更多格式 | 高清、无水印(增值服务) |
查看“Table 4 Multiple regression of interpolated species richness against four selected factors (LA, STR, IB, and MDE) for th”的人还看了
-

- 表1 华北地区国家级自然保护区内药用维管植物的物种丰富度Table 1 Species richness of medicinal vascular plants in national nature reserves in North C
-

- 表2 华北地区保护区内有分布记录药用维管植物物种数量排名前十的科信息Table 2List of families of top ten species richness of medicinal vascular plants in th


