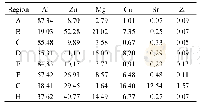
《Table 9 Phase distributions》
 提示:宽带有限、当前游客访问压缩模式
本系列图表出处文件名:随高清版一同展现
《Performance analysis of the SAW joint of duplex stainless steel clad plate》
%
Next,several characteristic areas of the alloy layer w eld seam w ere tested to determine the distribution of the main anti-corrosive elements such as Ni,Cr,and Mo.Fig.6 schematizes the point locations of the energy spectrum analysis of Ni,Cr,and Mo.The test areas included the junction of the base and alloy layer w elds(A),the middle position of the alloy layer w eld(B),and the outermost area of the alloy layer w eld(C).The field of view of each area w as magnified 40 times.Ten points w ere taken from each field at equal intervals from bottom to top,and the chemical composition of these points w as determined via scanning electron microscopy.For an accurate analysis,the acquisition time of each point w as set to 30 s,w hich ensured a total count of more than 250 000 for every point.The test results are show n in Table 8.Because the SAW melting pool w as relatively uniform,no major changes w ere observed in the distributions of Cr,Ni,and M o in the A,B,and C areas.This also confirms that the w elded joint has good corrosion resistance.
| 图表编号 | XD004647500 严禁用于非法目的 |
|---|---|
| 绘制时间 | 2018.09.30 |
| 作者 | QIAN Weifang |
| 绘制单位 | Research Institute,Baoshan Iron & Steel Co.,Ltd. |
| 更多格式 | 高清、无水印(增值服务) |


