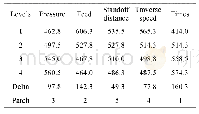
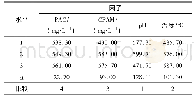
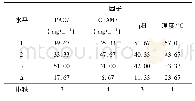
《Table 3 Mean value response table》
 提示:宽带有限、当前游客访问压缩模式
本系列图表出处文件名:随高清版一同展现
《Simulation analysis of hot dip galvanizing process parameters based on orthogonal experimental design》
Range analysis w as applied to analyze the result of the bottom slag height.We obtained the mean response table,as show n in Table 3,and the trend of each factor level as show n in Fig.3.
| 图表编号 | XD004633500 严禁用于非法目的 |
|---|---|
| 绘制时间 | 2018.03.30 |
| 作者 | LYU Junyi、GE Liang、MIAO Rui |
| 绘制单位 | Baosteel-NSC Automotive Steel Sheets Co.,Ltd.、School of Mechanical Engineering,Shanghai Jiao Tong University、School of Mechanical Engineering,Shanghai Jiao Tong University |
| 更多格式 | 高清、无水印(增值服务) |


