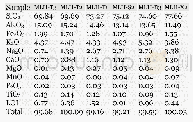
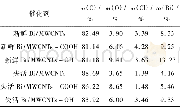
《Table 4.Surface elemental composition of Ce and Zr in different catalysts deter-mined by XPS.》
 提示:宽带有限、当前游客访问压缩模式
本系列图表出处文件名:随高清版一同展现
《Sulfur-resistant methanation over MoO_3/CeO_2–ZrO_2 catalyst: Influence of Ce-addition methods》
Fig.2(b)shows the Raman spectra of the catalysts after sulfidation.The bands at 181 cm-1and 460 cm-1were attributed to Zr O2and CeO2,respectively.In addition,the bands appearing at 381 and 405 cm-1are ascribed to MoS2[33,34],while a weak band attributed to defect oxygen(600 cm-1)was found.The concentration of Mo S2and defect oxygen were reflected by(I2+I3)/I1,I5/I1(I1,I2,I3and I5is the peak intensity of the bands at 181 cm-1,381 cm-1,405 cm-1and600 cm-1),which is shown in Table 3.The highest values of(I2+I3)/I1and I5/I1were obtained for 10Mo/CeZr-DP catalyst after sulfidation,which presented the optimum sulfur-resistant methanation activity.So the amounts of MoS2and defect oxygen are considered main factors affecting on the methanation activity.
| 图表编号 | XD0042895200 严禁用于非法目的 |
|---|---|
| 绘制时间 | 2019.01.01 |
| 作者 | Zhaopeng Liu、Yan Xu、Zhenhua Li、Baowei Wang、Weihan Wang、Xinbin Ma、Renjie Liu |
| 绘制单位 | Key Laboratory for Green Chemical Technology of Ministry of Education, School of Chemical Engineering and Technology, Collaborative Innovation Center of Chemical Science and Engineering (Tianjin), Tianjin University、Key Laboratory for Green Chemical Techn |
| 更多格式 | 高清、无水印(增值服务) |


