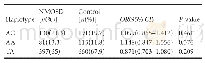
《Table 7 Results of the analysis of selected haplotypes at the GTF2IRD1–GTF2I locus for the potentia
 提示:宽带有限、当前游客访问压缩模式
本系列图表出处文件名:随高清版一同展现
《Association of GTF2IRD1–GTF2I polymorphisms with neuromyelitis optica spectrum disorders in Han Chinese patients》
Loci chosen for haplotype analysis:rs11981999 and rs4717901.All haplotype frequencies<0.05 were ignored in the analysis.All of the P-values were calculated using logistic regression analyses,and adjusted by sex and age.P<0.05 was considered statistically
Based on previous studies(Li et al.,2013;Jabbi et al.,2015;Zheng et al.,2015;Kim et al.,2016;Morris et al.,2016;Song et al.,2016;Sun et al.,2016),five SNPs,including GT-F2IRD1 rs4717901 and rs11981999,GTF2I rs117026326 and rs2527367,and rs73366469 in the GTF2IRD1–GTF2I intergenic region,were selected for genotyping(Table 1).
| 图表编号 | XD0040609000 严禁用于非法目的 |
|---|---|
| 绘制时间 | 2019.02.01 |
| 作者 | Jing-Lu Xie、Ju Liu、Zhi-Yun Lian、Hong-Xi Chen、Zi-Yan Shi、Qin Zhang、Hui-Ru Feng、Qin Du、Xiao-Hui Miao、Hong-Yu Zhou |
| 绘制单位 | Department of Neurology, West China Hospital, Sichuan University、Department of Neurology, West China Hospital, Sichuan University、Department of Neurology, West China Hospital, Sichuan University、Department of Neurology, West China Hospital, Sichuan Univer |
| 更多格式 | 高清、无水印(增值服务) |
![Table 5 An rs4944831-rs1783596-rs4944832 haplotype analysis[n (%) ]of the P2RY2 gene in ischemic stroke patients and con](http://bookimg.mtoou.info/tubiao/gif/SJZY201903021_15300.gif)
