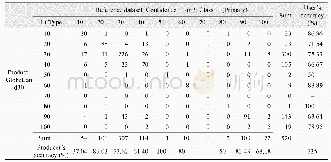
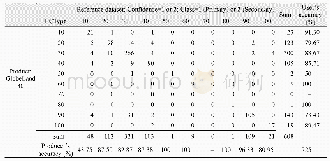
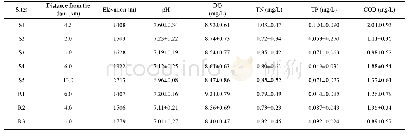
《Table 2.Column summation of the connectivity matrix shown in Fig.9 for 2008–2010》
 提示:宽带有限、当前游客访问压缩模式
本系列图表出处文件名:随高清版一同展现
《"A model for the transportation and distribution of jellyfish Rhopilema esculentum for stock enhancement in the Liaodong Bay, China"》
The summation of Row j represents the percentage of particles released from Site j that are transported to any of the five fishing grounds(hereafter referred to as the retention rate).A retention rate of 1 indicates that all of the particles are transported to the fishing grounds(Table 1).Almost all of the particles released from HLD,JZ,PJ and YK are transported to the fishing ground in each of the three modeled years.This implies that the jellyfish released from these sites are highly likely to be caught during the fishing season.However,the particles released from WFD exhibited retention rates of only 0.45 and 0.27 in 2008 and 2010.
| 图表编号 | XD0040193000 严禁用于非法目的 |
|---|---|
| 绘制时间 | 2019.01.01 |
| 作者 | Liping Yin、Xiujuan Shan、Chang Zhao、Xianshi Jin、Guansuo Wang、Fangli Qiao |
| 绘制单位 | First Institute of Oceanography, Ministry of Natural Resources、Laboratory for Regional Oceanography and Numerical Modeling, Pilot National Laboratory for Marine Science and Technology (Qingdao)、Key Laboratory of Marine Science and Numerical Modelling, Min |
| 更多格式 | 高清、无水印(增值服务) |
查看“Table 2.Column summation of the connectivity matrix shown in Fig.9 for 2008–2010”的人还看了
-

- 表3 凤凰镇2012年、2015年地表覆盖转移矩阵Table 3 The transfer matrixes of ground mulching on Fenghuang town in 2012 and 2015


