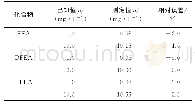
《Tab.3 Test set accuracy rate for the vehicle of various methods》
 提示:宽带有限、当前游客访问压缩模式
本系列图表出处文件名:随高清版一同展现
《Convolutional Neural Network Based on Spatial Pyramid for Image Classification》
%
The vehicle database is composed of 64×64pixel RGB images which are split into 13 491train images and 1 349test image.And each contains truck,car,bus and van(4classes).For the database,we make them in the range[0 1],and then make it gray.In Tab.3,CNN gets the result of52.34%when the learning rate is 0.1.And LeNet-5gets the result of 25%.LeNet-5can't recognize the database.The results wouldn't change when the learning rate is changed.It shows that LeNet-5's applicability is narrow.Our method achieves the result of 79.26%when learning rate is 1.It is the best accuracy among the three methods.
| 图表编号 | XD003876500 严禁用于非法目的 |
|---|---|
| 绘制时间 | 2018.12.01 |
| 作者 | Gaihua Wang、Meng Lü、Tao Li、Guoliang Yuan、Wenzhou Liu |
| 绘制单位 | Hubei Collaborative Innovation Centre for High-Efficiency Utilization of Solar Energy,Hubei University of Technology、School of Electrical and Electronic Engineering,Hubei University of Technology、School of Electrical and Electronic Engineering,Hubei Unive |
| 更多格式 | 高清、无水印(增值服务) |
查看“Tab.3 Test set accuracy rate for the vehicle of various methods”的人还看了
-

- Table 3 Comparison of 4 data sets (when the difference of misclassification rates in test sets is small) 表3 4个数据集的对比情况 (


