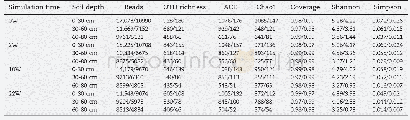
《Table 2–Richness and diversity indices of the bacterial/fungal community.》
 提示:宽带有限、当前游客访问压缩模式
本系列图表出处文件名:随高清版一同展现
《Vertical response of microbial community and degrading genes to petroleum hydrocarbon contamination in saline alkaline soil》
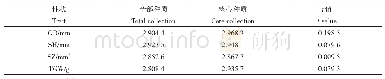
Richness and diversity estimator indices(ACE,Chao,Simpson,and Shannon)of the bacterial and fungal community revealed substantial variation between surface soil and deeper soil layers(Table 2).OTUs have been the most commonly used units of microbial diversity,especially when analyzing small subunit 16S or 18S rRNA marker gene sequence datasets,surface soil demonstrated a higher OTUrichness and Shannon diversity index than deeper soils in the study.The value of Shannon diversity index showed a decrease trend in the same depth of soil with the simulation time.That might be result from the toxic effects of oil to microorganism in the initial phase,while the specific strain of PHs-degrading microbe such as Pseudomonas,Marinobacter showed abundant accumulation in the later experimental period.Not surprisingly,previous study also verified the similar case that the total microbial diversity decreased withcrude oil addition,however,the abundance of PHs-degrader increased gradually(Yang et al.,2014).PCoA analysis depicted the relationship of microbial community structures with each other in different depth of soils(Appendix A Fig.S4).Both the bacterial and fungal communities were partitioned into three group according to the soil depth,even though they scattered in biplots with simulation time.PCoA analysis indicated that soil depth and incubation time were the main influence factors in composition of microbial communities.
| 图表编号 | XD0033529000 严禁用于非法目的 |
|---|---|
| 绘制时间 | 2019.07.15 |
| 作者 | Qinglong Liu、Jingchun Tang、Xiaomei Liu、Benru Song、Meinan Zhen、Nicholas J.Ashbolt |
| 绘制单位 | College of Environmental Science and Engineering, Nankai University、College of Environmental Science and Engineering, Nankai University、Key Laboratory of Pollution Processes and Environmental Criteria (Ministry of Education)、Tianjin Engineering Research C |
| 更多格式 | 高清、无水印(增值服务) |
