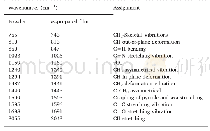
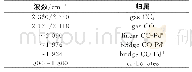
《Table 2–Infrared spectroscopy (IR) absorption bands.》
 提示:宽带有限、当前游客访问压缩模式
本系列图表出处文件名:随高清版一同展现
《Investigation of adsorption/desorption behavior of Cr(Ⅵ) at the presence of inorganic and organic substance in membrane capacitive deionization(MCDI)》
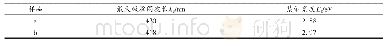
The comparison of experimental data and kinetic models for Cr(VI)were represented in Fig.5,and the kinetic model parameters estimated values for Cr(VI)are shown in Table 3.For the solution F1–F9,a comparative graph of experimental and calculated value of the absorption amount(mg/g)showed that Cr(VI)absorption was in good agreement with the pseudo-first-order model.As presented in Table 3,the correlation coefficients,R2,showed that the pseudo-first-order model fitted better the experimental data than the pseudo-second-order model(Li et al.,2009).These results suggested that the electrosorption was because of electrostatic interactions between ions and electrodes.
| 图表编号 | XD0033527900 严禁用于非法目的 |
|---|---|
| 绘制时间 | 2019.04.15 |
| 作者 | Lin Chen、Chengyi Wang、Shanshan Liu、Liang Zhu |
| 绘制单位 | Key Laboratory of Integrated Regulation and Resources Development of Shallow Lakes,Hohai University、College of Environment,Hohai University、Key Laboratory of Integrated Regulation and Resources Development of Shallow Lakes,Hohai University、College of Envi |
| 更多格式 | 高清、无水印(增值服务) |