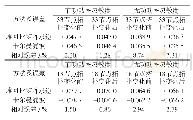
《Table 1–Comparison of maximum voltage, power density and internal resistance with different nitrite
 提示:宽带有限、当前游客访问压缩模式
本系列图表出处文件名:随高清版一同展现
《Nitrite pre-treatment of dewatered sludge for microbial fuel cell application》
The power density of each MFC was 83.81,94.66,101.07,55.57 and 42.70 mW/m2when the amount of nitrite added to the dewatered sludge was 0,50,100,150,and 200 mg-N/L,respectively,as shown in Table 1.The performance of a MFC can be expressed using the power density obtained from the polarization and power density curve(shown in Appendix A).The maximum power density of a MFC is obtained when its internal resistance is lowest.The internal resistance of a MFC can be affected by various factors,including pH,substrate concentration,and temperature.
| 图表编号 | XD0033518200 严禁用于非法目的 |
|---|---|
| 绘制时间 | 2019.03.15 |
| 作者 | Abdul Rasyid Ruslan、Vel Murugan Vadivelu |
| 绘制单位 | School of Chemical Engineering, Universiti Sains Malaysia,Engineering Campus、School of Chemical Engineering, Universiti Sains Malaysia,Engineering Campus |
| 更多格式 | 高清、无水印(增值服务) |
查看“Table 1–Comparison of maximum voltage, power density and internal resistance with different nitrite concentration.”的人还看了
-

- Table 3 Productivity of single sweet sorghum plant under different plant density and its comparison results


