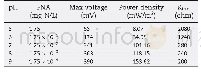
《Table 1 Maximum value of density fluctuation, and fitting residual according to separate inversion
 提示:宽带有限、当前游客访问压缩模式
本系列图表出处文件名:随高清版一同展现
《3D Joint inversion of gravity and gravity tensor data》
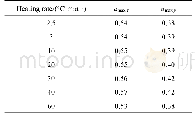
gxxand gyyare chosen for joint inversion to verify the constraint effect of cross gradient method in horizontal direction.Fig.4 shows the inversion results of separate linear method and the cross gradient method.Table 1 illutrates the maximum densities and the fitting residuals of separate inversion and cross gradient joint inversion with the same iterations.It is indicated that gxxdata has more information in Y direction,and gyydata has more information in X direction.Compared with the separate linear inversion results,the cross gradient inversion results of gxxand gyydata in Fig.4 are with higher accuracy and resolution,especially on the boundary.It proves that the cross gradient method can synthesize information in different directions.
| 图表编号 | XD0014146700 严禁用于非法目的 |
|---|---|
| 绘制时间 | 2018.03.25 |
| 作者 | ZHAO Simin、GAO Xiuhe、QIAO Zhongkun、JIANG Dandan、ZHOU Fei、LIN Song |
| 绘制单位 | College of Geo-Exploration Science and Techonology,Jilin University、College of Geo-Exploration Science and Techonology,Jilin University、Guangzhou Marine Geological Survey、College of Geo-Exploration Science and Techonology,Jilin University、College of Geo-E |
| 更多格式 | 高清、无水印(增值服务) |