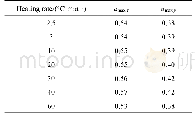
《Table 1 Values of maximum conversion fractions at different heating rates in z (α) and y (α) graphs
 提示:宽带有限、当前游客访问压缩模式
本系列图表出处文件名:随高清版一同展现
《非晶态Ni_(55)Nb_(35)Si_(10)合金的非等温纳米结晶动力学(英文)》
Figure 7 represents the variation of y(α)and z(α)with crystallized fraction,α,at different heating rates.As shown in Fig.7 and Table 1,the maximum value of z(α)falls in the range of 0.53-0.57;whereas that of y(α)falls in the range of 0.38-0.42.The values ofαmax,z in the present study are smaller than the finger print of the JMA model predicted by Malek.Thus,according to Malek model,JMA model is not applicable to describe the crystallization kinetics of Ni-Nb-Si glass in the present case.
| 图表编号 | XD0064472900 严禁用于非法目的 |
|---|---|
| 绘制时间 | 2019.02.01 |
| 作者 | H.MINOUEI、G.H.AKBARI、M.H.ENAYATI、S.I.HONG |
| 绘制单位 | Department of Metallurgy and Materials Science, Shahid Bahonar University、Department of Metallurgy and Materials Science, Shahid Bahonar University、Department of Material Engineering, Nanotechnology and Advanced Material Institute,Isfahan University of Te |
| 更多格式 | 高清、无水印(增值服务) |
查看“Table 1 Values of maximum conversion fractions at different heating rates in z (α) and y (α) graphs”的人还看了
-

- 表1 面板最大折算应力值对比Tab.1 Comparision of maximum conversion stress of the panel under different water sealing arrangement


