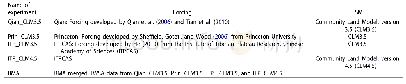
《Table 1.Numerical experimental design.》
 提示:宽带有限、当前游客访问压缩模式
本系列图表出处文件名:随高清版一同展现
《A Numerical Study of Mesoscale Vortex Formation in the Midlatitudes:The Role of Moist Processes》
In this study,the LHF was taken to be the main element of the moist processes.The numerical experiment scheme is shown in Table 1.In EXP1,the LHF scheme was switched off for the whole run,whereas in EXP2 it was switched on as the perturbation was introduced into the model at t=17h.In the control simulations(i.e.,real simulations,considering the LHF but without MWP),the 700-hPa m LLJ to the south of the col point that occurs at t=17 h intensifies with the integration.The maximum wind speed of the m LLJ was greater than 12 m s-1at t=24 h in association with the intensification of the MβV and rainfall(figures omitted).Without considering the LHF,the m LLJ and MβV cannot form,so the MWP was introduced into the model at t=17 h.
| 图表编号 | XD0030264900 严禁用于非法目的 |
|---|---|
| 绘制时间 | 2019.01.10 |
| 作者 | Yongqiang JIANG、Yuan WANG、Chaohui CHEN、Hongrang HE、Hong HUANG |
| 绘制单位 | Key Laboratory of Mesoscale Severe Weather、Ministry of Education of China,and School of Atmospheric Sciences,Nanjing University、Institute of Meteorology and Oceanography,National University of Defense Technology、Key Laboratory of Mesoscale Severe Weather、 |
| 更多格式 | 高清、无水印(增值服务) |

