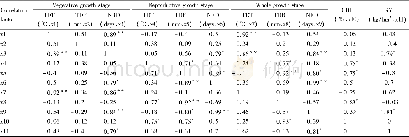
《Table 3 Relationships between SPAD and Chl for Oak(Quercus variabilis Bl.)》
 提示:宽带有限、当前游客访问压缩模式
本系列图表出处文件名:随高清版一同展现
《伏牛山栓皮栎叶绿素含量野外测量与实验室分析数据集》
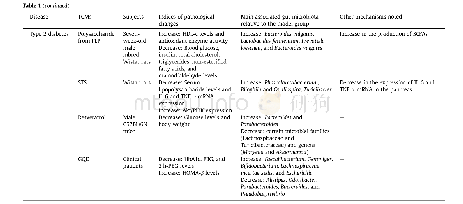
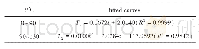
Correlation relationships of SPAD and Chl were analyzed and four types of regression models were developed(Table 3).According to Coefficient of Determination(R2),the best-fit of SPAD-Chl for total chlorophyll goes to exponential regressive model,with a R2 of 0.927.Within Chl,the SPAD-Chl relationship for chlorophyll a(Chla)is better than that for chlorophyll b(Figure 1).
| 图表编号 | XD0027640600 严禁用于非法目的 |
|---|---|
| 绘制时间 | 2018.12.24 |
| 作者 | 王正兴、李芳 |
| 绘制单位 | 中国科学院地理科学与资源研究所资源与环境信息系统国家重点实验室、中国科学院地理科学与资源研究所资源与环境信息系统国家重点实验室 |
| 更多格式 | 高清、无水印(增值服务) |
