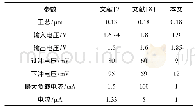
《Table 2 Comparison of results with the original NCEP/NCAR temperature data》
The regression tree model was applied to the corresponding NDVI and DEM data to obtain the monthly temperature data with 1 km spatial resolution.The data were aggregated to the NCEP/NCAR scale(50 km)using a simple averaging method.The averaged data were then subtracted from the NCEP/NCAR data.The residuals were interpolated using the thin spline technique to the 1 km scale,by adding this high-resolution residual to the predicted temperature and precipitation at 1 km resolution,the final downscaled monthly average temperature and monthly total precipitation of China at 1 km resolution being obtained.Figure 3 shows the downscaled temperature for May 2005.
| 图表编号 | XD0027612100 严禁用于非法目的 |
|---|---|
| 绘制时间 | 2017.03.25 |
| 作者 | 荆文龙、杨雅萍、乐夏芳 |
| 绘制单位 | 中国科学院地理科学与资源研究所、中国科学院大学、中国科学院地理科学与资源研究所、中国科学院地理科学与资源研究所 |
| 更多格式 | 高清、无水印(增值服务) |
查看“Table 2 Comparison of results with the original NCEP/NCAR temperature data”的人还看了
-

- Table 2 Comparison of AIM charges, obtained from different types of EEM methods, with the results calculated at the B3LY
-

- Table 2–Concentrations of PAHs with different rings and their removal efficiency in the original soil, light, and heavy
 提示:宽带有限、当前游客访问压缩模式


![表2 测试样本中原始[Si]序列与预测[Si]序列统计学比较结果Table 2 Statistical comparison of the original[Si]sequence with the predicted[Si]sequenc](http://bookimg.mtoou.info/tubiao/gif/HOCE201804022_05300.gif)
