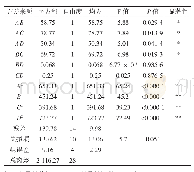
《Table 7 Regression coefficients and their significance test (t-test)》
 提示:宽带有限、当前游客访问压缩模式
本系列图表出处文件名:随高清版一同展现
《不同播期对秋闲田饲用高粱株高、叶茎比与干鲜比的影响(英文)》
According to the test data in Table 2,the plant height-,leaf stem ratio-and DW/FW ratio-sowing date scatter plots of forage sorghum were drawn with SPSS 22(Fig.1).As shown in Fig.1,the relationships between plant height,leaf stem ratio,DW/FW ratio and sowing date of forage sorghum were approximately linear.In order to explore the most suitable regression model,10 equations(Table6)were simulated with the measured values of plant height,leaf stem ratio and DW/FW ratio of forage sorghum using“curve estimation”of SPSS 22[14].The significance values were all below 0.01,i.e.,the constructed equations had biological significance.Among them,the determination coefficients of the linear equation(Y=a+b X)and the quadratic equation(Y=a+b X+c X2)of plant height were both the largest(0.955,0.955),and the F value of the linear equation was the largest(340.416).The determination coefficients of the linear equation and the quadratic equation of leaf stem ratio were 0.938 and 0.939,respectively,and the F value of the linear equation was the largest(244.116).The determination coefficients of the linear equation and the quadratic equation of DW/FW ratio were 0.761 and 0.841,respectively,and the F value of the linear equation was the largest(50.992).As linear equation is characterized with simple,fast and accurate calculation compared with quadratic equation and the determination coefficients and F values of linear models of plant height,leaf stem ratio and DW/FW ratio were larger,the linear regression model(Y=a+bX)was chosen for analysis for its simple and accurate calculation,high fitting degree and excellent fitting effect.In the equation,Y represents plant height,leaf stem ratio and DW/FW ratio of forage sorghum;X represents the conversion value of sowing date;a represents regression intercept;and b represents slope.
| 图表编号 | XD0026684600 严禁用于非法目的 |
|---|---|
| 绘制时间 | 2018.04.01 |
| 作者 | 周汉章、刘环、贾海燕、周新建、魏志敏、李顺国、刘海忠 |
| 绘制单位 | 河北省农林科学院谷子研究所国家谷子改良中心河北省杂粮研究重点实验室、深泽县农业局、河北省农林科学院谷子研究所国家谷子改良中心河北省杂粮研究重点实验室、石家庄市农业局、河北省农林科学院谷子研究所国家谷子改良中心河北省杂粮研究重点实验室、河北省农林科学院谷子研究所国家谷子改良中心河北省杂粮研究重点实验室、河北省农林科学院粮油作物研究所 |
| 更多格式 | 高清、无水印(增值服务) |


