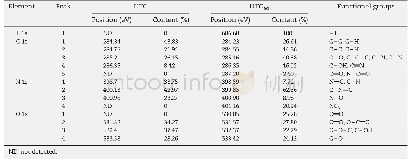
《Table 3–Relative content of the functional groups of used tea-leaf biochar before (UTC) and after (
 提示:宽带有限、当前游客访问压缩模式
本系列图表出处文件名:随高清版一同展现
《Study of ciprofloxacin removal by biochar obtained from used tea leaves》
The FTIR spectra were analyzed to identify the characteristic functional groups of the adsorbents.The 4000–400 cm-1infrared spectral regions of the UTC and UTCadare shown in Fig.7.Several obvious peaks can be observed in the infrared spectra of UTC.As shown in Table 2,the functional groups,including the stretching vibrations of\\OH(3400 cm-1),the C_C bond in an aromatic ring or C_C bond(1570 cm-1),C\\H alkanes(1435 cm-1)and C\\O in phenol(1167 cm-1),are clearly identified.Two other weak peaks at 2917 and2850 cm-1are related to the symmetric and asymmetric stretching vibrations of methylene(Huang et al.,2015;Malkoc and Nuhoglu,2006;Sun et al.,2016).
| 图表编号 | XD0025354800 严禁用于非法目的 |
|---|---|
| 绘制时间 | 2018.11.15 |
| 作者 | Jie Li、Guangwei Yu、Lanjia Pan、Chunxing Li、Futian You、Shengyu Xie、Yin Wang、Jianli Ma、Xiaofu Shang |
| 绘制单位 | Key Laboratory of Urban Pollutant Conversion,Institute of Urban Environment,Chinese Academy of Sciences、University of Chinese Academy of Sciences、Key Laboratory of Urban Pollutant Conversion,Institute of Urban Environment,Chinese Academy of Sciences、Key L |
| 更多格式 | 高清、无水印(增值服务) |


![Table 4 Functional groups of coke de posit on the spe nt catalysts[9]](http://bookimg.mtoou.info/tubiao/gif/RLHX201902005_11300.gif)

![表4 2组相关因素实施率对比[n (%) ]Table 4 Comparison of the relative factors in the two groups of children[n (%) ]](http://bookimg.mtoou.info/tubiao/gif/HNSJ201816011_29000.gif)