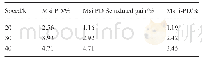
《Table 4MSI percentages at 20, 30, and 40 kn》
 提示:宽带有限、当前游客访问压缩模式
Both controllers were then tested at three different operating speeds(20,30,and 40 kn).This time the PD controller was tested twice.First,with maintaining the gains of the PD controller constant and the second with retuning the gains at each nominal plant related to each speed while the gains of the i-PD controller were maintained fixed.Table 4 resumes the obtained MSI for the three controllers at three different working speeds.
| 图表编号 | XD0024729100 严禁用于非法目的 |
|---|---|
| 绘制时间 | 2018.06.25 |
| 作者 | Mounia Ticherfatine、Qidan Zhu |
| 绘制单位 | College of Automation, Harbin Engineering University、College of Automation, Harbin Engineering University |
| 更多格式 | 高清、无水印(增值服务) |
![表2 不同入模温度下的回冻效果[20]Table 2 Refreezing times and maximum temperature rises at mould temperature of 5, 10 and 15℃[20]](http://bookimg.mtoou.info/tubiao/gif/BCDT201802018_31900.gif)

