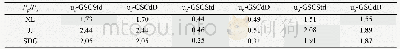
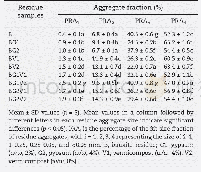
《Table 2 The proportional ratio between sandy paleosol samples and sand samples for each grain size
 提示:宽带有限、当前游客访问压缩模式
本系列图表出处文件名:随高清版一同展现
《Comparison of two classification methods to identify grain size fractions of aeolian sediment》
Note:Pp is the average proportion of sandy paleosol samples,Ps is the average proportion of sand samples.Grey shade reflects a better grain size fraction for each grain size data sequence.
The average proportion ratio between samples of sandy paleosol and of sand was calculated for each grain-size fraction of all grain size data sequences(Table 2).Compared to the grain size fraction uc-GSC-dD,the proportion ratio of uc-GSCStd shows lower value in all three sections(the gray shade in Table 2).Similarly,the differences of us-GSCStd vs.us-GSCdD also display in all three sections,larger proportion ratios in JJ and SDG correspond to us-GSCStd,while the larger proportion ratio in XL corresponds to us-GSC-dD(the gray shade in Table 2).However,the difference of uf-GSCStd vs.uf-GSCdD only exist in XL(the gray shade in Table 2).It seems that the classification differences between GSCStd and GSCdD methods come from grain-size fractions uc and us.AN-OVA was also conducted for each of three grain size fraction pair of uf,uc and us.The results show that,the proportion ratio produced by the GSCStd method does not significantly differ from that of the GSCdD method(at the 0.05 significant level).
| 图表编号 | XD0023782700 严禁用于非法目的 |
|---|---|
| 绘制时间 | 2018.10.01 |
| 作者 | YanZai Wang、YongQiu Wu、MeiHui Pan、RuiJie Lu |
| 绘制单位 | College of Geography and Tourism, Chongqing Normal University、State Key Laboratory of Earth Surface Process and Resource Ecology, Beijing Normal University、Engineering Center of Desertification and Blown-Sand Control, Ministry of Education, Beijing Normal |
| 更多格式 | 高清、无水印(增值服务) |