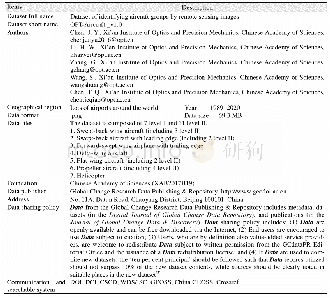
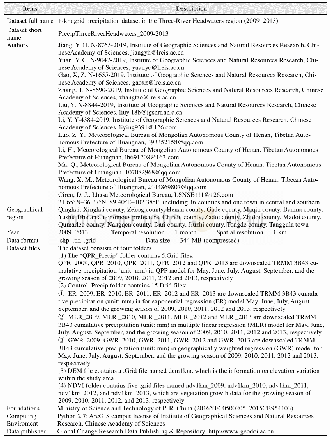
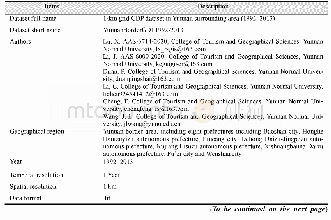
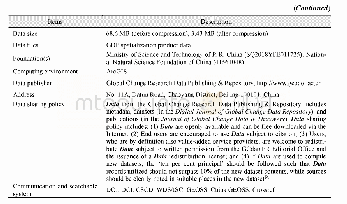
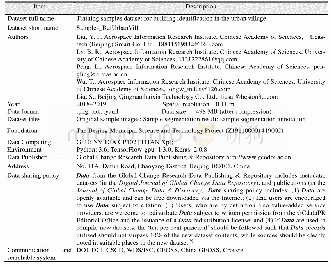
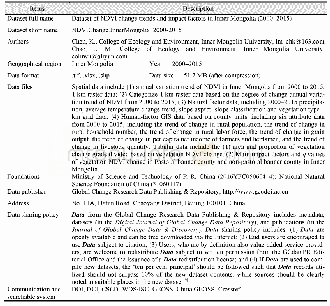
《Table 1 Metadata summary of the dataset》
 提示:宽带有限、当前游客访问压缩模式
本系列图表出处文件名:随高清版一同展现
《中亚五国未来棉花和冬小麦作物需水量模拟预测数据集(2020-2100)》
whereΔindicates the slope of changes in water vapor pressure with temperature (k Pa·oC-1),Rn indicates the net radiation (MJ·m–2·day–1),G represents the soil heat flux (MJ·m–2·day–1),γrepresents the psychrometric constant (k Pa·oC-1),T is the daily average temperature (oC),U2 is the daily average wind velocity at a height of 2 m (m·s-1),es refers to the saturation vapor pressure (k Pa),ea refers to the actual vapor pressure (k Pa),and[CO2]refers to the atmospheric CO2 concentration (ppm).The specific calculation method of each variable is shown in the“FAO No.56 Irrigation and Drainage Manual”[11].
| 图表编号 | XD00206975200 严禁用于非法目的 |
|---|---|
| 绘制时间 | 2020.06.25 |
| 作者 | 田静 |
| 绘制单位 | 中国科学院地理科学与资源研究所陆地水循环及地表过程重点实验室 |
| 更多格式 | 高清、无水印(增值服务) |
