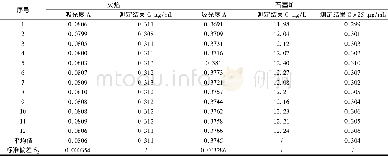
《Table 2 T value determination statistics excerpt》
 提示:宽带有限、当前游客访问压缩模式
本系列图表出处文件名:随高清版一同展现
《An empirical research on the field of wireless charging based on patent life length》
This paper employs exhaustive method to determine the validity of T.Combined with the research and common sense of scholars,this paper sets the range of T from 1 to 50.Under the condition of double-proportion 60%-60%,the obsolescence of the sample patent was calculated when the value of T is taken as 1,2...50 respectively.Table 2 shows the distribution and obsolescence rates of selected patent categories under different T,the observation time is from January1995 to December 2015,and the total number of sample patents is 4541.The first type of patents in the table refers to the patent that hasn’t been cited for the first time in the period of(T+DE)months from the approval date;the second type of patents refer to the number of obsolescence patents during the observation time;the third type of patents refers to the number of patents that are not expired during the observation time;the number of obsolescence P1 patent refers to the number of invalid patent citation within the effective life span occupying more than P1(60%)of the total citation number during observation time;the obsolescence-P2 proportion refers to the proportion of the number of invalid-P1 patents and the number of nonobsolescence patents in the total number of invalid patents and non-obsolescence patents.
| 图表编号 | XD0020599200 严禁用于非法目的 |
|---|---|
| 绘制时间 | 2018.03.01 |
| 作者 | 施敏、Wang Juncheng、Zhou Xiaodan、Hu Yiyuan、Zhao Zelong |
| 绘制单位 | School of Information Management,Wuhan University、Institute of Scientific and Technical Information of Guangxi、Institute of Scientific and Technical Information of China、Institute of Scientific and Technical Information of China、School of Information Reso |
| 更多格式 | 高清、无水印(增值服务) |


