《Table 2 Statistics of homogenization temperature values from different measuring processes》
 提示:宽带有限、当前游客访问压缩模式
本系列图表出处文件名:随高清版一同展现
《Fluid Inclusions in Surface-temperature Halite: Sample Preparation and Application》
Note:Th-homogenization temperatures;AVG-average;MIN-minimum;MAX-maximum.0 day means sample cooling in stage.
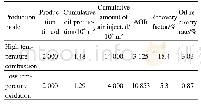
In total,475 homogenization temperatures were measured.94 homogenization temperatures were measured from fluid inclusions that were cooled in the heating/freezing stage,and 89,96,95 and 101homogenization temperature values were from sample that were cooled in freezer for 1,10,20 and 40 days,respectively.Th values range from 9.5 to 25.8℃(mean of19.6℃,median of 20℃)for samples prepared in the heating/freezing stage,from 8 to 26℃(mean of 19.8℃,median of 19.8℃)for samples prepared in freezer for 1days,from 3.5 to 25.8℃(mean of 18.7℃,median of19.3℃)for samples prepared in freezer for 10 days,from1.2 to 27.7℃(mean of 21.3℃,median of 21.4℃)for samples prepared in freezer for 20 days,from 8.3 to26.5℃(mean of 20.6℃,median of 21.6℃)for samples prepared in freezer for 40 days(Table 2).
| 图表编号 | XD0017178300 严禁用于非法目的 |
|---|---|
| 绘制时间 | 2018.08.01 |
| 作者 | WANG Mingquan、ZHAO Yanjun、LI Wenxia、LIU Chenglin |
| 绘制单位 | China University of Geosciences、MLR Key Laboratory of Metallogeny and Mineral Assessment, Institute of Mineral Resources,CAGS、Qinghai Institute of Salt Lakes, Chinese Academy of Science、MLR Key Laboratory of Metallogeny and Mineral Assessment, Institute o |
| 更多格式 | 高清、无水印(增值服务) |
查看“Table 2 Statistics of homogenization temperature values from different measuring processes”的人还看了
-

- Table 2.Logistic modeling of density values measured from test malts during fermentations using the miniature fermentati
-

- Table 7.The statistics of production effects of low temperature oxidation and high temperature combustion.


