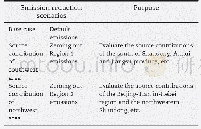
《Table 2 Emissions in the 100%abatement scenarios for the NEM and Java-Bali power systems, and costs
 提示:宽带有限、当前游客访问压缩模式
本系列图表出处文件名:随高清版一同展现
《Power system decarbonisation with Global Energy Interconnection——a case study on the economic viability of international transmission network in Australasia》
The information for the existing NEM generation units such as capacity,emission factors,expected decommissioning dates,etc.shown Table B1 and B2 in Appendix B are obtained from AEMO’s annual NTNDP report[14].For all newly built thermal plants,we consider the thermal efficiency and combustion emission intensity provided by the Australian Energy Technology Assessment(AETA)[16].
| 图表编号 | XD0020054000 严禁用于非法目的 |
|---|---|
| 绘制时间 | 2018.10.01 |
| 作者 | Changlong Wang、Roger Dargaville、Matthew Jeppesen |
| 绘制单位 | The Energy Transition Hub、The University of Melbourne、The Energy Transition Hub、Monash University、The University of Melbourne |
| 更多格式 | 高清、无水印(增值服务) |


