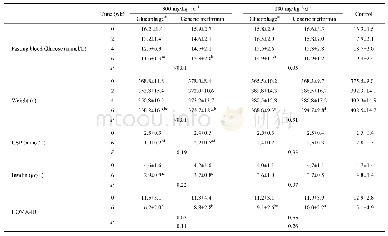
《Table 1Parasitemia, PCV and weight body during experimental period (mean±SE) .》
 提示:宽带有限、当前游客访问压缩模式
本系列图表出处文件名:随高清版一同展现
《A survey of biochemical and acute phase proteins changes in sheep experimentally infected with Anaplasma ovis》
*-Represents a significant difference between parameter’s concentrations on different days with day 0 as control(P<0.05).
During the post infection days,maximum level of parasitemia was revealed on day 12(1.44±0.46)%by microscopic examination of blood smears(Table 1).
| 图表编号 | XD00187345700 严禁用于非法目的 |
|---|---|
| 绘制时间 | 2018.12.01 |
| 作者 | Zohreh Khaki、Seyedeh Parastoo Yasini、Seyedeh Missagh Jalali |
| 绘制单位 | Department of Clinical Pathology,Faculty of Veterinary Medicine,University of Tehran、Department of Clinical Sciences,Faculty of Veterinary Medicine,Islamic Azad University、Department of Clinical Sciences,Faculty of Veterinary Medicine,Shahid Chamran Unive |
| 更多格式 | 高清、无水印(增值服务) |
查看“Table 1Parasitemia, PCV and weight body during experimental period (mean±SE) .”的人还看了
-

- Table 3.Fasting blood glucose, body weights, GSP, insulin and HOMA-IR in Zucker diabetes fatty rats receiving Glucophage


