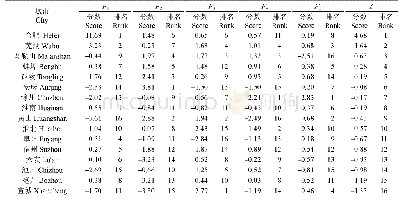
《Table 7 Comprehensive scores of quality traits in various rice variety groups》
 提示:宽带有限、当前游客访问压缩模式
本系列图表出处文件名:随高清版一同展现
《Principal Component and Cluster Analysis of Quality Traits in Ningxia Rice》
Data in the table are the mean values of various quality traits in various rice varieties,and figures in brackets are scores.
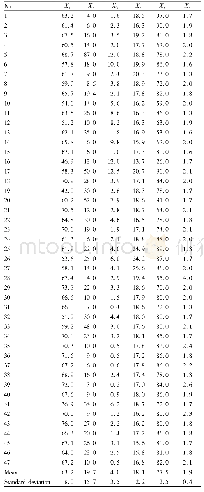
The principal component values of various varieties were calculated according to the five principal component formulas(Y1-Y5),as shown in Table 6.Cluster analysis was performed to the47 varieties according to the data in Table 6,obtaining a clustering pedigree chart(Fig.1).It could be seen from Fig.1 that at the clustering level of 6.92,the 47 tested varieties could be divided into 7 groups.The third group comprised most varieties,18 varieties,which accounted for 38.3%of all the varieties.The varieties in this group show head rice rates and amylose contents reaching the national high-quality japonica rice standards,and their yields are all at a higher level.The first group comprised 13 varieties,which accounted for 27.7%of all the varieties.It could be seen from Fig.1 that the 13 varieties included all new high-quality rice varieties existing in Ningxia.The second group only comprised one variety,Ningjing 31,which is an introduced variety.It has slightly longer grains with lower gel consistency.The fourth group and the sixth group both comprised three varieties.The fifth group and the seventh group had four and five varieties,respectively.The comprehensive evaluation of the seven groups is shown in Table 7.It could be seen from Table 7 that the first group performed the best in rice quality traits.Excluding length-width ratio in the six indices of this group,other indices scored 15 points in total.For japonica rice,there is no strict requirement for lengthwidth ratio,so the varieties in this group are exactly high-quality rice,which is accordant with production.As to the third group,chalky kernel percentage and chalkiness degree restricted the improvement of its score,while as ordinary rice,they have quite high head rice rate and yield,and are varieties enjoyed by processing enterprises,so they occupy two thirds of the planting area in Ningxia and surrounding area.The varieties included in the fourth group scored 0 point for chalky kernel percentage and chalkiness degree,and have exit market due to their appearance and the improvement of people’s living standard.The fifth group had lower scores for various quality traits.The sixth group and seventh group only scored three points for gel consistency and amylose content,and performed worse on other traits.In short,it could be seen from Table 7 that the varieties in the seven groups could become the dominant varieties with extension value only when they performed better in chalky kernel percentage and chalkiness degree.This indicates that chalky kernel percentage and chalkiness degree are the main factors restricting rice quality.
| 图表编号 | XD00183118500 严禁用于非法目的 |
|---|---|
| 绘制时间 | 2018.10.01 |
| 作者 | Jing MA、Jianchang SUN、Yongping AN、Caifen WANG |
| 绘制单位 | Crop Research Institute,Ningxia Academy of Agriculture and Forestry、Crop Research Institute,Ningxia Academy of Agriculture and Forestry、Crop Research Institute,Ningxia Academy of Agriculture and Forestry、Crop Research Institute,Ningxia Academy of Agricult |
| 更多格式 | 高清、无水印(增值服务) |


